
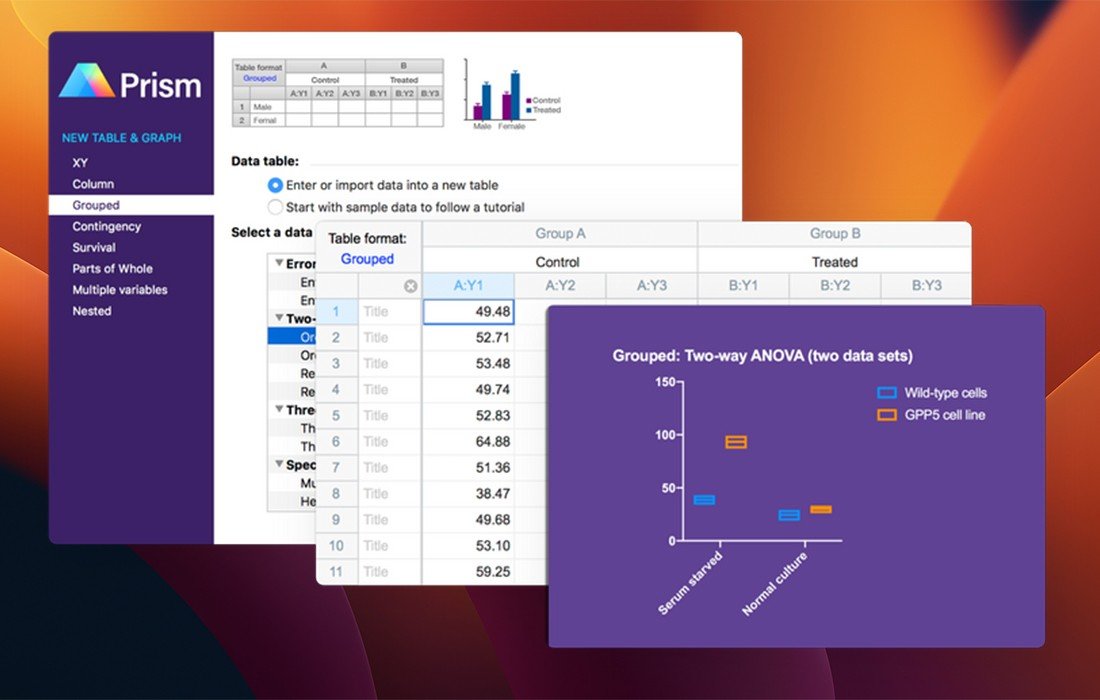
GraphPad Prism is the graphing and statistics app found in biology, pharmacology and medical labs worldwide. It's designed for scientists rather than statisticians.
You begin by choosing a table type that matches your experiment – column data, grouped data, XY, survival – and Prism suggests suitable analyses and graphs.
- t-tests and one- or two-way ANOVA with multiple comparisons
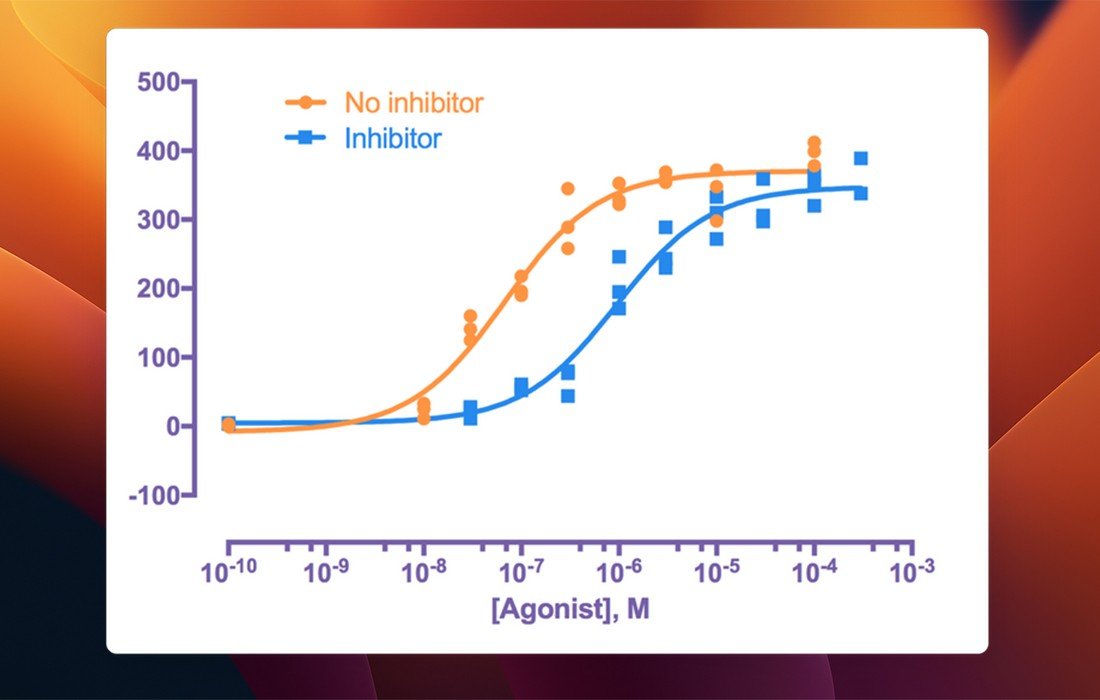
- Nonlinear regression for dose-response, kinetics and binding
- Kaplan-Meier survival analysis
- Correlation, contingency tables and non-parametric tests
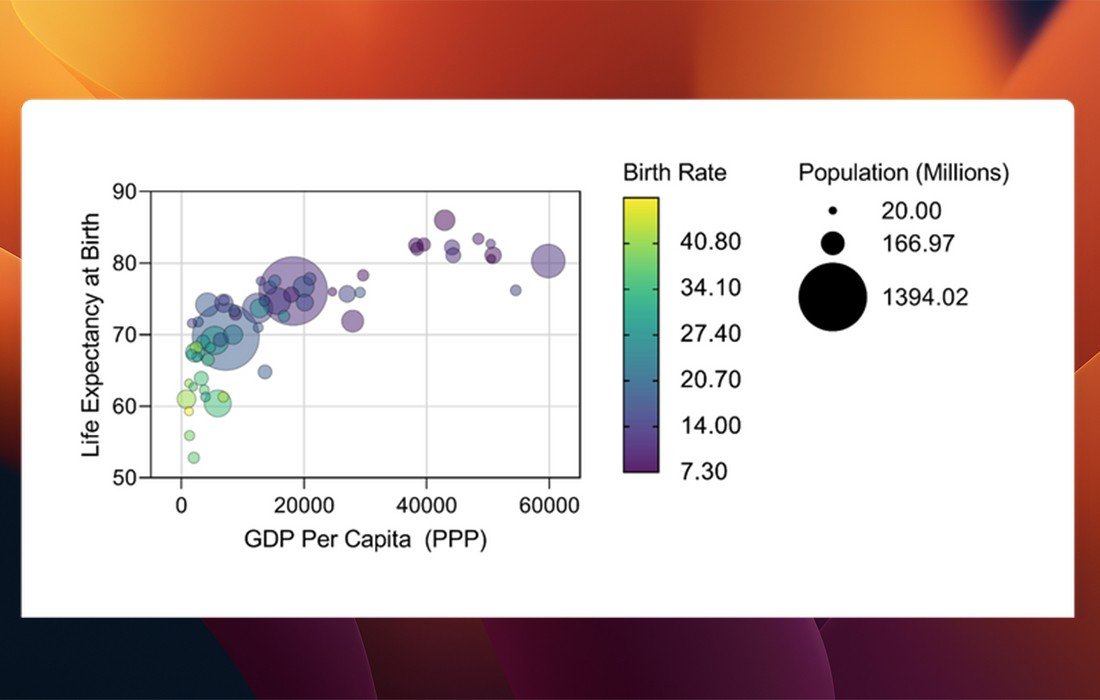
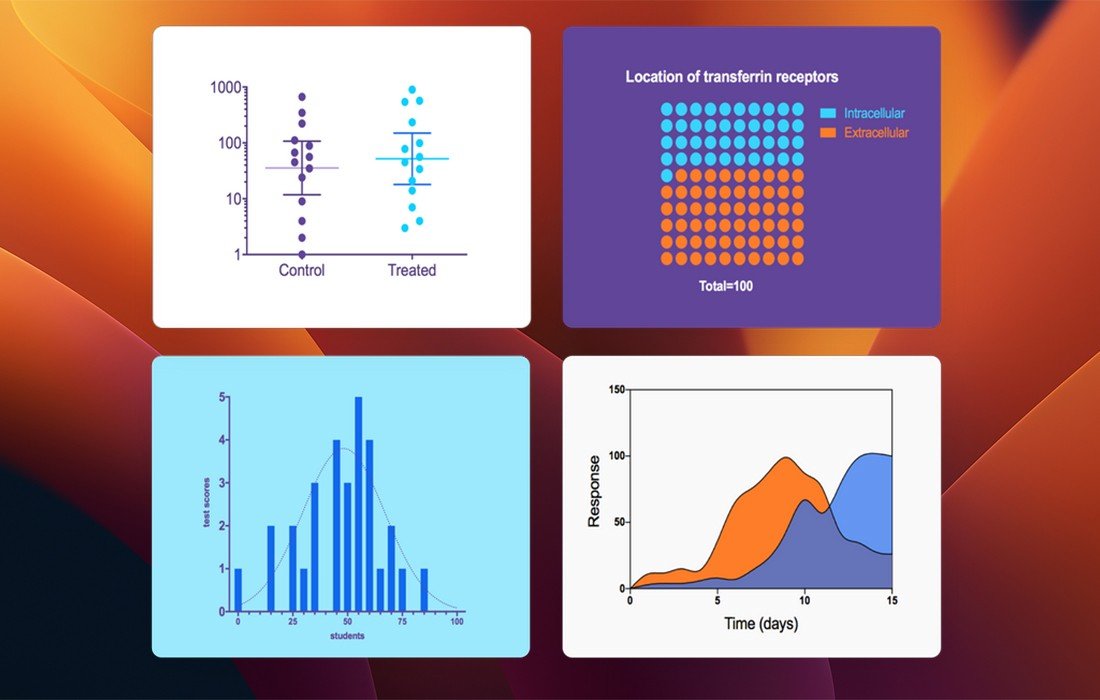
- Publication-ready graphs that update when data changes
Results come with plain-language explanations and assumption checklists.